Latest TempLS update using GHCN V4
Report: global average anomaly as at 2026-10-18 based on 11215 stations for latest month, mesh weighting, anomaly base 1961-90
| Month | Apr | May | Jun | Jul | Aug | Sep |
| Anomaly °C | 1.063 | 0.969 | 1.026 | 1.104 | 1.259 | 1.186 |
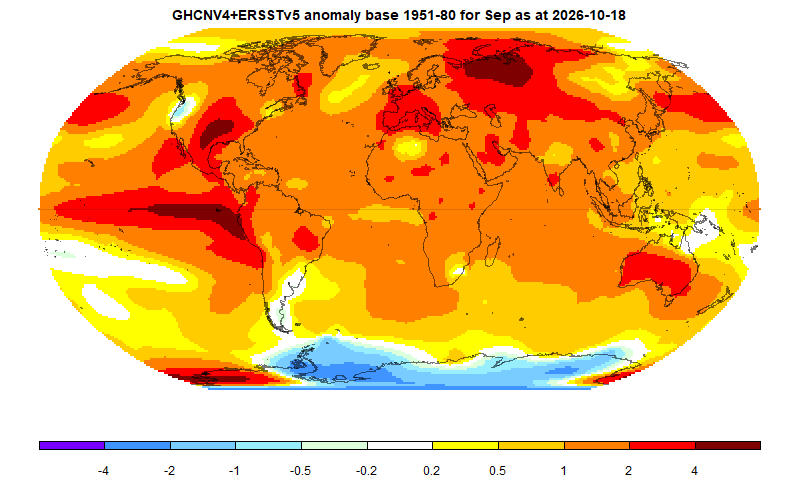
Here is the FEM based plot of anomalies in °C
Here is the breakdown of contributions to the monthly anomalies (see post). Click arrows for other versions.
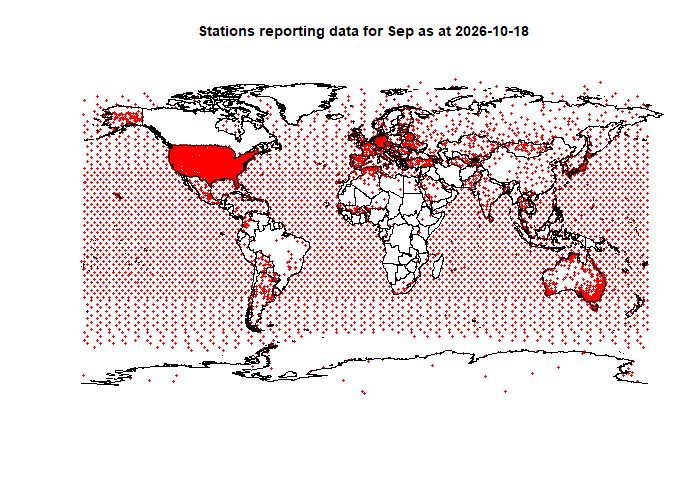
Here is the map of stations reporting