Statistics
Demand Response
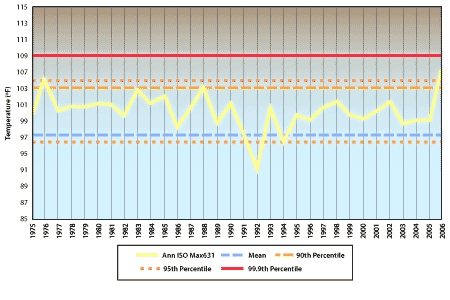
The California Independent System Operator (CAISO) keeps track of weather conditions for the purpose of managing power on the grid. They have produced data such as the graph below tracking increasing temperatures over the last several years and the climbing peak temperatures. For example, the 2006 Max631* was the highest on record since 1975 for the region served by the CAISO. These extreme conditions occurred through much of July and were not only extreme in their magnitude, but also in their occurrence throughout California (a low probability occurrence) as well as throughout the Western Electricity Coordinating Council (WECC) Interconnection (an even lower probability occurrence). Demand response is a vital tool for California cities and counties to shave peak energy use and avoid costly blackouts. Read about demand response in municipal projects.
Annual Maximum CAISO Daily Max631* Temperature based on
Weighted Average of 24 Weather Stations
Source: California Independent System Operator
*The Max631 temperature buildup index is a weighted average of the daily maximum temperatures for a given day and the two days prior to that day. As an example, the Max631 for July 24 would be calculated as follows:
Max631 = 0.6 X (July 24th max temp) + 0.3 X (July 23rd max temp) + 0.1 X (July 22nd max temp)


